Aerial Intelligence for Smarter Operations
FIELD-READY CROP INTELLIGENCE FOR ONTARIO FARMS
Drone mapping, AI-powered crop analysis, NDVI imaging, and aerial scouting built to help Ontario growers spot issues earlier, reduce input waste, and make faster field decisions.
48HR
100%
3
Turnaround available
Field coverage
Packages
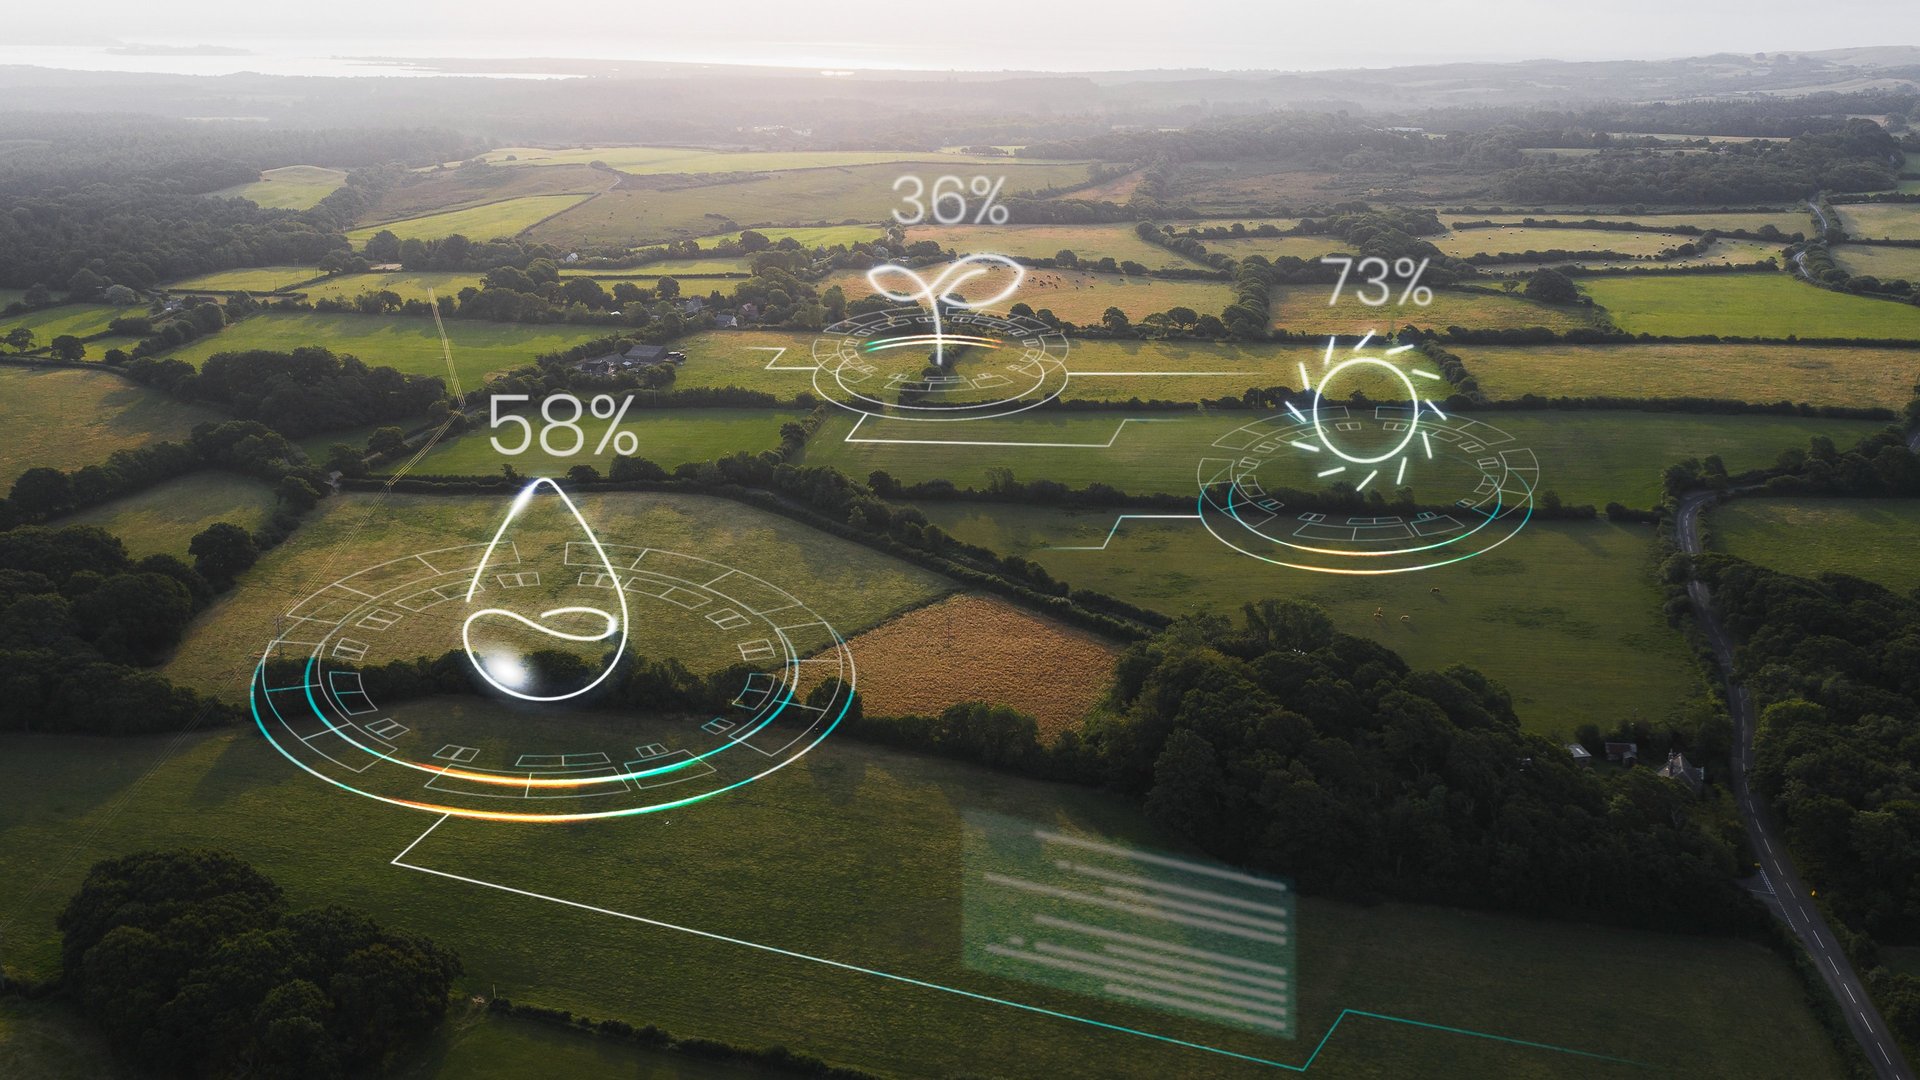
Traditional scouting covers a fraction of your field. DroneWise maps every acre with multispectral imaging and delivers AI-powered health reports — no boots required.

PRECISION AGRICULTURAL DRONE SERVICES.
Dronewise combines advanced drone technology with AI-powered crop analysis to help Ontario farmers monitor crop health, improve efficiency, and reduce unnecessary input costs throughout the growing season.
Using high-resolution aerial imagery, multispectral analysis, and intelligent crop monitoring tools, we help growers identify field issues before they become costly problems.
Detect early signs of crop stress, disease pressure, nutrient deficiencies, and irrigation issues using aerial imagery and AI-assisted analysis. GPS-tagged reporting helps identify exactly where action is needed in the field.


CROP STRESS & DISEASE DETECTION
Spot Problems Before They Spread
Monitor crop vigor, biomass, and plant health across every acre with NDVI and multispectral imaging. Identify variability early and make informed decisions on spraying, fertilization, and irrigation.
NDVI & MULTISPECTRAL IMAGING
See What The Naked Eye Can't
Evaluate crop emergence and plant populations with aerial stand counting. Quickly identify weak zones, replant areas, and population inconsistencies across the field.
PLANT STAND COUNTS
Accurate Emergence Analysis
Get detailed stitched aerial maps for a complete field overview. Compare seasonal changes, monitor crop development, and identify patterns impacting yield potential.
ORTHOMOSAIC FIELD MAPPING
High-Resolution Field Intelligence
Track canopy development and crop performance throughout the growing cycle using aerial imagery and vegetation analysis tools.
CANOPY COVERAGE ANALYSIS
Monitor Crop Growth Through The Season
Combine drone imaging with satellite-based monitoring for ongoing crop intelligence throughout the season. Monitor changes in crop health and detect stress before irreversible damage occurs.
SATELLITE & DRONE MONITORING
Full-Season Crop Visibility
WE FLY YOUR FIELD
A Transport Canada certified pilot flies a multispectral or RGB mission over your farm. One flight covers the entire field — no sampling, no skipped rows. Typical missions take under two hours for 500 acres.
SIMPLE. FAST. FIELD-READY.
HOW IT WORKS
01
Your imagery is processed through our analysis platform, generating NDVI, NDRE, and stress index maps. The AI flags anomalies, scores zone severity, and identifies areas that need attention — automatically.
Within 48 hours, your field report is ready — viewable online or exported as shapefiles your equipment can read. You know exactly where to look and what to do, without spending days walking rows.
AI PROCESSES THE DATA
YOU GET ACTIONABLE DATA
02
03
FIELD SCOUT
RGB high-resolution aerial imaging
NDVI crop health map (PDF report)
Stressed zone identification & GPS boundaries
48-hr data delivery
AI insights — automated anomaly flagging with severity scores
PRICING PACKAGES
All packages include Transport Canada certified pilots, and AI-powered analysis. No agronomist required — though your agronomist will love the data.
Includes Field Scout Package Plus:
Multispectral imaging (NDVI, NDRE, GNDVI)
3 scheduled flights - early, mid & late season
Pest & disease pressure mapping
AI insights - trend analysis accross all 3 flights with yield risk scoring per zone
Multispectral + thermal dual-sensor imaging
5 scheduled flights + 1 emergency re-fly
Soil moisture & stress index layering
Full GIS-compatible export (shapefile/KML)
End-of-season yield correlation summary
AI Insights - real time anomaly alerts, predictive stress modelling & season-over-season benchmarking
GROWTH WATCH
PRECISION PRO
ENTRY LEVEL
SEASONAL MONITORING
PREMIUM
$12/acre
$18/acre-per visit
$28/acre-per visit
100 acre minimum-single visit
200 acre minimum - 3 visit seasonal package
500 acre minimum - 5 visit seasonal package
MOST POPULAR
FLY. SCOUT. GROW
Your time has real value
Flying, uploading, processing, and interpreting data takes 3–5 hours per 100 acres — during the same weeks you're already stretched thin.
The real cost of doing it yourself.
WHY NOT DIY?
Owning a drone sounds simple. But between certification, software, maintenance, and the hours it takes to fly and process data during your busiest weeks — the numbers add up fast.


Hidden costs add up
A multispectral drone, Transport Canada certification, processing software, and insurance easily add $15,000+ before you fly a single acre.


Consistency matters for data trends
Year-over-year benchmarking only works if flights are calibrated and processed consistently. Our standardised workflow makes every season comparable.


CANOPY CLOSURE & STAND ESTABLISHMENT
Identify emergence gaps, uneven plant populations, and poor stand uniformity early — when there's still time to respond.
EVERY STRESS INDICATOR. EVERY ACRE.
WHAT WE SCOUT
Our multispectral missions are calibrated to detect the issues that matter most for Ontario cash crop production.
DISEASE & PEST PRESSURE
Detect early indicators of grey leaf spot, corn rootworm, soybean aphid, and other regional threats before they spread across your field.
NUTRIENT DEFICIENCY MAPPING
NDRE and GNDVI indices reveal nitrogen, sulphur, and iron deficiencies that visible-light scouting routinely misses until damage is already done.
APPLICATION UNIFORMITY
Verify that herbicide and fertilizer passes covered the field evenly. Skips, overlaps, and boom shutoff errors show up clearly in post-application imagery.
WATER & DRAINAGE STRESS
Thermal and multispectral layers identify wet spots, compaction zones, and drainage constraints that limit yield in otherwise well-managed fields.
VARIABLE RATE PRESCRIPTION ZONES
Flight data feeds directly into GIS-compatible prescription maps, ready to load into your John Deere, CNH, or AGCO field controller for targeted input application.
"The AI anomaly report flagged a drainage issue I'd been ignoring for years. Seeing it mapped across 80 acres finally convinced me to fix it."
"We caught a grey leaf spot outbreak in the northeast corner of our biggest corn field three weeks earlier than we would have on foot. That flight paid for itself before we even submitted the invoice."
Mark T.
★★★★★
★★★★★
BUILT FOR ONTARIO OPERATIONS
WHAT FARMERS SAY
1,100-acre cash crop operation, Middlesex County
Dave R.
900-acre soybean & wheat, Perth County
Ready to see your whole field?
Book a flight or reach out with questions. We service operations across Southwestern and Central Ontario — typically scheduling within 2 weeks during the growing season.
© 2026 Dronewise Ltd.
Contact Us
COMPANY
RESOURCES
ROI Calculator
Service Locations
Ontario Drone Report
Our Story